Health is probably the most valued human asset. In fact, studies on the preference for different states of being show that virtually everyone rates health as most important. Despite the perceived importance of health, health status has remained difficult to define. There are two common themes in definitions of health. First, premature death is undesirable, so one aspect of health is the avoidance of mortality. The health status of nations is often evaluated in terms of mortality rates or infant mortality rates (infant mortality is the number of children who die before 1 year of age per 1,000 live births).
Second, quality of life is also very important. Disease and disability are of concern because they affect either life expectancy or life quality. For example, cancer and heart disease are the two major causes of premature death in the United States. In addition, disease or disability can make life less desirable. A person with heart disease may face restrictions in daily living activities and may be unable to work or participate in social activities. Even relatively minor diseases and disabilities affect quality of life. A cold, for example, may interfere with the ability to concentrate, work, or attend school. A cold, however, lasts only a short time. A chronic disease, such as arthritis, may affect the quality of life for a long time.
Within the recent years, medical scientists have come to realize the importance of quality-of-life measurement. Many major diseases, including arthritis, heart disease, and diabetes, and digestive problems are evaluated in terms of the degree to which they affect life quality and life expectancy. One can also evaluate treatments for these conditions by the amount of improvement they produce in quality of life. The Food and Drug Administration now considers quality-of-life data in their evaluations of new products, and nearly all major clinical trials in medicine use quality-of-life assessment measures. Several approaches to quality-of-life measurement are reviewed in the following sections.
What Is Health-Related Quality of Life?
There are numerous methods for the assessment of health-related quality of life. There is now an entire journal devoted to quality-of-life measurement, and several professional societies focus on the topic. Methods of assessment of health-related quality of life represent at least two different conceptual traditions. One grows out of the tradition of health status measurement. Several efforts to develop measures of health status were launched in the late 1960s and early 1970s. All the projects were guided by the World Health Organizations (WHHO) definition of health status as a “complete state of physical, mental, and social well-being and not merely absence of disease” (WHO, 1948). The projects resulted in a variety of assessment tools, including the Sickness Impact Profile, the Quality of Weil-Being Scale, the SF-36, and the Nottingham Health Profile. Many of the measures examine the effect of disease or disability on performance of social role, ability to interact in the community, and physical functioning. Some of the systems have separate components for the measurement of physical, social, and mental health. The measures also differ in the extent to which they consider subjective aspects of life quality.
Perhaps the most important distinction among methods used to assess quality of life is the contrast between psychometric and decision-theoretic approaches. The psychometric approach attempts to provide separate measures for the many different dimensions of quality of life. Perhaps the best-known example of the psychometric tradition is the Sickness Impact Profile (SIP). The SIP is a 136-item measure, and yields 12 different scores displayed in a format similar to a Minnesota Multiphasic Personality Inventory profile.
The decision-theoretic approach attempts to weight the different dimensions of health to provide a single expression of health status. Supporters of this approach argue that psychometric methods fail to consider that different health problems are not of equal concern. A runny nose is not the same as severe chest pain. In an experimental trial using the psychometric approach, one will often find that some aspects of quality of life improve while others get worse. For example, a medication might reduce high blood pressure but also produce headaches and impotence. Many argue that the quality-of-life notion is the subjective evaluation of observable or objective health states. The decision-theoretic approach attempts to provide an overall measure of quality of life that integrates subjective function states, preferences for these states, morbidity, and mortality.
Common Methods for the Measurement of Quality of Life
Various methods have been proposed to measure quality of life, but rather than attempt to review and critique them all here, this section presents some of the most widely used psychometric and decision-theory-based methods. Readers interested in more detailed reviews should consult Walker and Rosser (1993) and McDowell and Newell (1996).
Psychometric Methods
SF-36
Perhaps the most commonly used outcome measure is the Medical Outcome Study Short Form-36 (SF-36). The SF-36 grew out of work by the RAND Corporation and the Medical Outcomes Study (MOS). Originally, it was based on the measurement strategy from the RAND Health Insurance Study. The MOS attempted to develop a very short, 20-item instrument known as the Short Form-20, or SF-20. However, the SF-20 did not have appropriate reliability for some dimensions. The SF-36 includes eight health concepts: physical functioning, role-physical, bodily pain, general health perceptions, vitality, social functioning, role-emotional, and mental health The SF-36 can be either administered by a trained interviewer or self-administered. It has many advantages. For example, it is brief, and there is substantial evidence for its reliability and validity. The SF-36 can be machine scored and has been evaluated in large population studies.
Despite its many advantages, the SF-36 also presents some disadvantages. For example, it does not have age-specific questions, and one cannot clearly determine whether it is equally appropriate at each level of the age continuum. The items for older, retired individuals are the same as those for children. Nevertheless, the SF-36 has become the most commonly used behavioral measure in contemporary medicine.
Nottingham Health Profile
The Nottingham Health Profile (NHP) is another profile approach, and has been used widely in Europe. One of the important features of the NHP is that the items were originally generated on the basis of extensive discussions with patients. The NHP has two parts. The first includes 38 items divided into six categories: sleep, physical mobility, energy, pain, emotional reactions, and social isolation. Items within each of these sections are rated in terms of relative importance. Items are rescaled to allow them to vary between 0 and 100 within each section. The second part of the NHP includes seven statements related to the areas of life most affected by health: employment, household activities, social life, home life, sex life, hobbies and interests, and holidays. The respondent indicates whether a health condition has affected his or her life in these areas. Used in a substantial number of studies, the NHP has considerable evidence for its reliability and validity.
An important strength of the NHP is that it is based on consumer definitions of health derived from individuals in the community. The language in the NHP is simple, and the scale requires only a low level of reading ability. Psychometric properties of the NHP have been evaluated in a substantial number of studies. However, the NHP, like most profile measures, does not provide relative-importance weightings across dimensions. As a result, it is difficult to compare the dimensions directly with one another.
Decision-Theoretic Approaches
Within recent years, interest has grown in using quality-of-life data to help evaluate the cost/utility or cost-effectiveness of health-care programs. Cost studies have gained in popularity because health care costs have grown so rapidly in recent years. Not all health care interventions equally return benefit for the expended dollar. Objective cost studies might guide policymakers toward an optimal and equitable distribution of scarce resources. Cost-effectiveness analysis typically quantifies the benefits of a health care intervention in terms of years of life, or quality-adjusted life-years (QALYs). Cost/utility analysis is a special case of cost-effectiveness analysis, which weights observable health states by preferences or utility judgments of quality. In cost/utility analysis, the benefits of medical care, behavioral interventions, and preventive programs are expressed in terms years of life adjusted for reduced quality of life, or QALYs.
If a man dies of heart disease at age 50 years and he was expected to live to age 75 years, we might conclude that the disease was responsible for 25 lost life-years. If 100 men died at age 50 years, each of whom had a life expectancy of 75 years, we might conclude that 2,500 (100 men x 25 years) life-years had been lost. Yet death is not the only relevant outcome of heart disease. Many adults suffer myocardial infarctions, which can leave them somewhat disabled for a long time. Although they are still alive, they suffer diminished quality of life. The QALY measure takes into consideration such consequences. For example, a disease that reduces quality of life by one-half will take away 0.5 QALY over the course of each year. If the disease affects two people, it will take away 1 life-year (2 x 0.5) over each year. A medical treatment that improves quality of life by 0.2 for each of five individuals will result in the equivalent of 1 QALY if the benefit persists for 1 year. This system has the advantage of considering both benefits and side effects of programs in terms of common QALY units.
The need to integrate mortality and quality-of-life information is clearly apparent in studies of heart disease. Consider hypertension. People with high blood pressure may live shorter lives if untreated, and longer lives if treated. Thus, one benefit of treatment is to add years to life. However, for most patients, high blood pressure does not produce symptoms for many years. Conversely, the treatment for high blood pressure may cause negative side effects. If one evaluates a treatment only in terms of changes in life expectancy, the benefits of the program will be overestimated because one has not taken side effects into consideration. On the other hand, considering only current quality of life will underestimate the treatment benefits because information on mortality (death) is excluded. In fact, considering only current function might make the treatment look harmful because the side effects of the treatment might be worse than the symptoms of hypertension. A comprehensive measurement system takes into consideration side effects and benefits and provides an overall estimate of the benefit of treatment (Russell, 1986).
Most of the several different approaches for obtaining quality-adjusted life years are similar. The three most commonly used methods are the EQ-5D, the Health Utilities Index (HUI), and the Quality of Well-being Scale (QWB).
EQ-5D
The approach most commonly used in the European community is the EQ-5D. This method, developed by Paul Kind and associates, has been developed by a collaborative group from Western Europe known as the EuroQol group. The intention of this effort was to develop a generic currency for health that could be used commonly across Europe. The concept of a common EuroQol was stimulated by the desire for a common European currency—the Eurodollar. The original version of the EuroQol had 14 health states in six different domains. Respondent health was placed on a continuum ranging from death (0.0) to perfect health (1.0). The method was validated in postal surveys in England, Sweden, and the Netherlands. More recent versions of the EuroQol, known as the EQ-5D, are now in use in a substantial number of clinical and population studies Although the EQ-5D is easy to use and comprehensive, there have been some problems with ceiling effects. Substantial numbers of people obtain the highest possible score.
Health Utilities Index
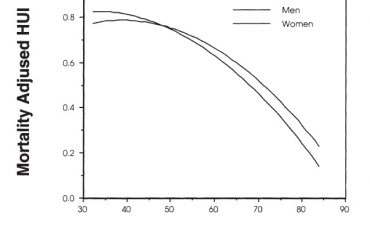
Another approach has been developed in Canada by Torrance, Feeny, Furlong, and associates. This method, known as the Health Utilities Index (HUI), is derived from microeconomic theory. There have been several versions of the measure, typically identified by “Mark” designations. The HUI Mark I was developed for studies in the neonatal intensive care unit. The measure had 960 unique health states. In 1992, the HUI Mark II was developed, and included 24,000 unique health states. The HUI Mark III, released in 1995, had 972,000 health states. The eight components of the HUI Mark III include vision (six levels), hearing (six levels), speech (five levels), ambulation (six levels), dexterity (six levels), emotion (five levels), cognition (six levels), and pain (five levels). Multiplying the number of levels across the eight dimensions gives the 972,000 states. Using multiattribute utility scaling methods, judges evaluate levels of wellness associated with each level of each domain. A multiattribute model is used to map preference for the 972,000 possible states onto the 0.0-1.0 continuum. The HUI has been used in many population and clinical studies. Figure 1 shows estimates of the HUI for men and women in the U.S. population. For overall health status, men obtain higher scores early in the life cycle. However, after about age 45 years, women obtain higher scores, and this difference grows systematically through the remainder of the life span.
Quality of Well-being Scale (QWB)
A third method, known as the Quality of Well-being Scale, integrates several components into a single score. First, patients are classified according to objective levels of functioning. These levels are represented by the scales of mobility, physical activity, and social activity. Once observable behavioral levels of functioning have been classified, each individual is placed on the 0-1.0 scale of wellness, which describes where a person lies on the continuum between optimum function and death.
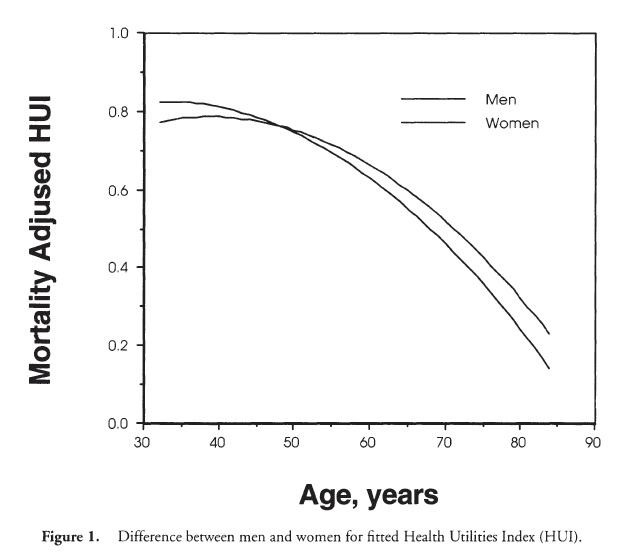 Figure 1. Difference between men and women for fitted Health Utilities Index (HUI).
Most traditional measures used in medicine and public health consider only whether a person is dead or alive. In other words, all living people get the same score. We know, however, that there are different levels of wellness, and there is a need to quantify these levels of wellness. To accomplish this, the observable health states are weighted by quality ratings for the desirability of these conditions. Human value studies have been conducted to place the observable states onto a preference continuum, with an anchor of 0 for death and 1.0 for completely well. Studies have shown that the weights are highly stable over a 1-year period and that they are consistent across diverse groups of raters. Finally, one must consider the duration of stay in various health states. Having a cough or a headache for 1 day is not the same as having the problem for 1 year. A health measure must take these durations into consideration. Using this information, one can describe health-related quality of life in terms similar to years of life. For example, one year in a state assigned the weight of 0.5 is equivalent to 0.5 of a QALY.
The QWB combines preference-weighted values for symptoms and functioning. The preference weights were obtained by ratings of856 people from the general population. These judges rated the desirability of health conditions in order to place each on the continuum between death (0.00) and optimum health (1.00). Symptoms are assessed by questions that ask about the presence or absence of different symptoms complexes. Functioning is assessed by a series of questions designed to record functional limitations over the previous 6 days, within three separate domains (mobility, physical activity, and social activity). The three domain scores are combined into a total score that provides a numerical point-in-time expression of well-being that ranges from zero (0) for death to one (1.0) for asymptomatic optimum functioning.
Disease-Specific Measures
This entry has focused on generic quality-of-life scales. However, there are a significantly larger number of disease-specific measures. Validated measures of health-related quality of life are available for illnesses such as arthritis, diabetes, heart disease, and kidney failure, and virtually every other major health condition. Two examples are the Arthritis Impact Measurement Scale and the UCSD Shortness of Breath Questionnaire, which is used in studies of patients with emphysema.
The Arthritis Impact Measurement Scales (AIMS) is a health index designed at the Multi-purpose Arthritis Center at Boston University. It is intended to measure physical health and social well-being for patients with rheumatoid arthritis. The resultant scale includes 67 items, with questions about functioning, health perceptions, morbidity, and demographics. The AIMS contains scales for mobility, physical activity, social activity, activities of daily living, depression and anxiety, and arthritis-related symptoms. In effect, it is an adaptation of an early version of the QWB with a series of items designed to tap more specifically the effect of arthritis on functioning and the quality of life. Factor analysis of the AIMS has produced three subscales: physical function, psychological function, and pain. Most current applications of the AIMS use composite scores for these three areas.
The University of California, San Diego Shortness of Breath Questionnaire (SOBQ) includes 25 items, which evaluate self-reported shortness of breath during the performance of various activities of daily living. Evaluations of the measure show it to be highly correlated with other quality-of-life measures such as the Quality of Well-Being Scale and the Center for Epidemiologic Studies Depression Scale. The measure has high internal consistency (alpha = 0.96) and is significantly correlated with performance measures such as the amount of distance that can be walked in 6 minutes.
Summary
Assessment of health-related quality of life has become a standard component of health outcome evaluation. There are several important distinctions among commonly used approaches. Generic measures are used to evaluate health outcome for any illness or disease state. Generic measures can typically be classified as derived from psychometric or decision theory. Psychometric approaches include the Sickness Impact Profile, the SF-36, and the Nottingham Health Profile. Decision-theoretic approaches are used to estimate outcomes in terms of quality-adjusted life years. Methods used for this purpose include the EQ-5D, the HUI, and the QWB. Disease-specific measures are available for a wide variety of health conditions. Although disease-specific measures may be more sensitive for outcomes of a particular condition, they cannot be used for cross-illness comparisons or for cost-effectiveness analysis. Assessment of health-related quality of life is a rapidly developing field, and major new developments can be anticipated over the next decade.
Leave a Reply